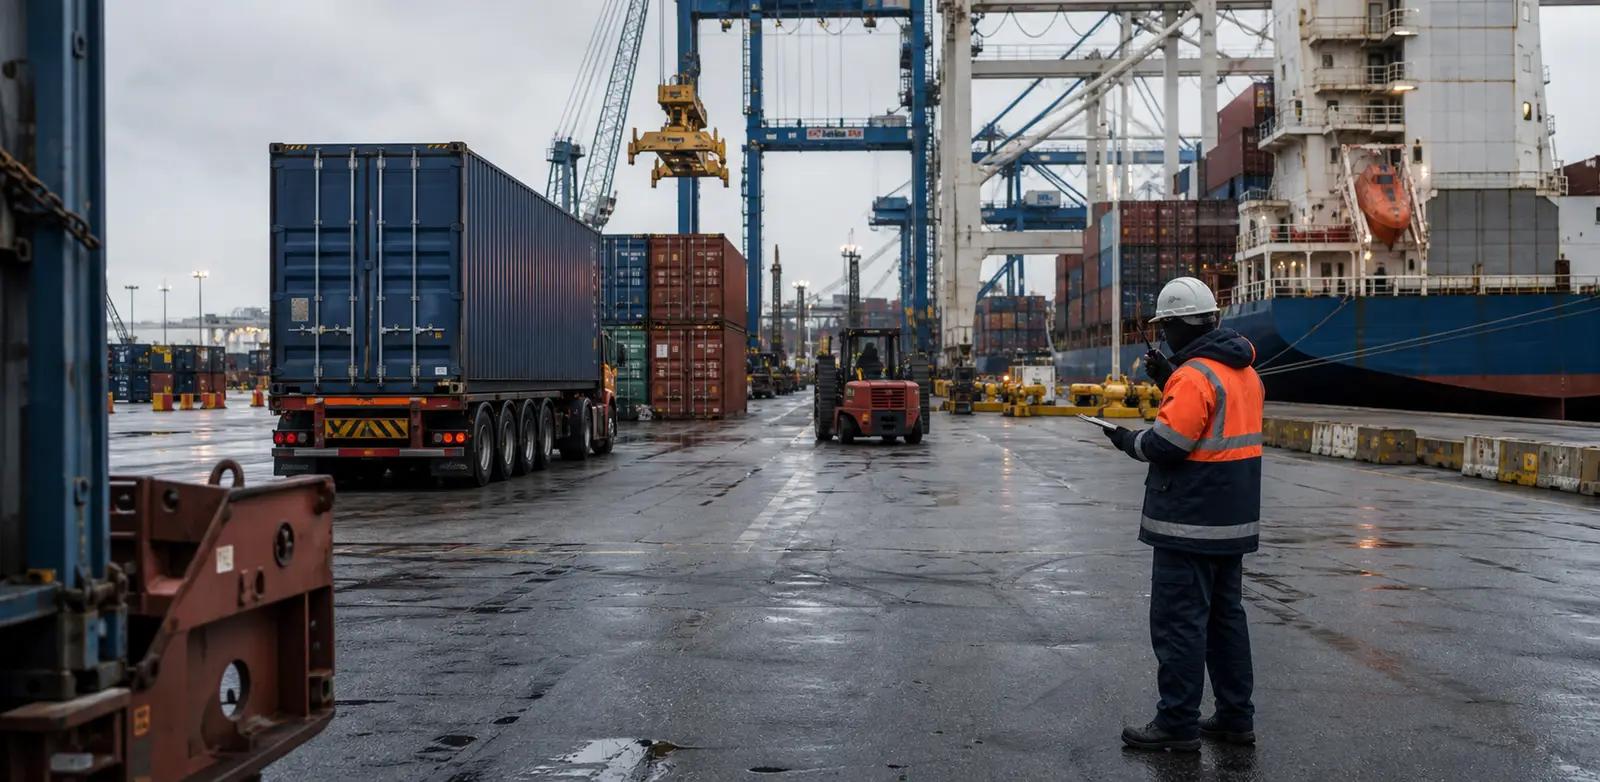
Red Sea Shipping Crisis 2026: Impact on Your Supply Chain
Summary: Houthi attacks continue to disrupt Red Sea shipping in 2026, rerouting vessels around the Cape of Good Hope, extending transit times and raising costs. This guide compares affected lanes and contingency options.
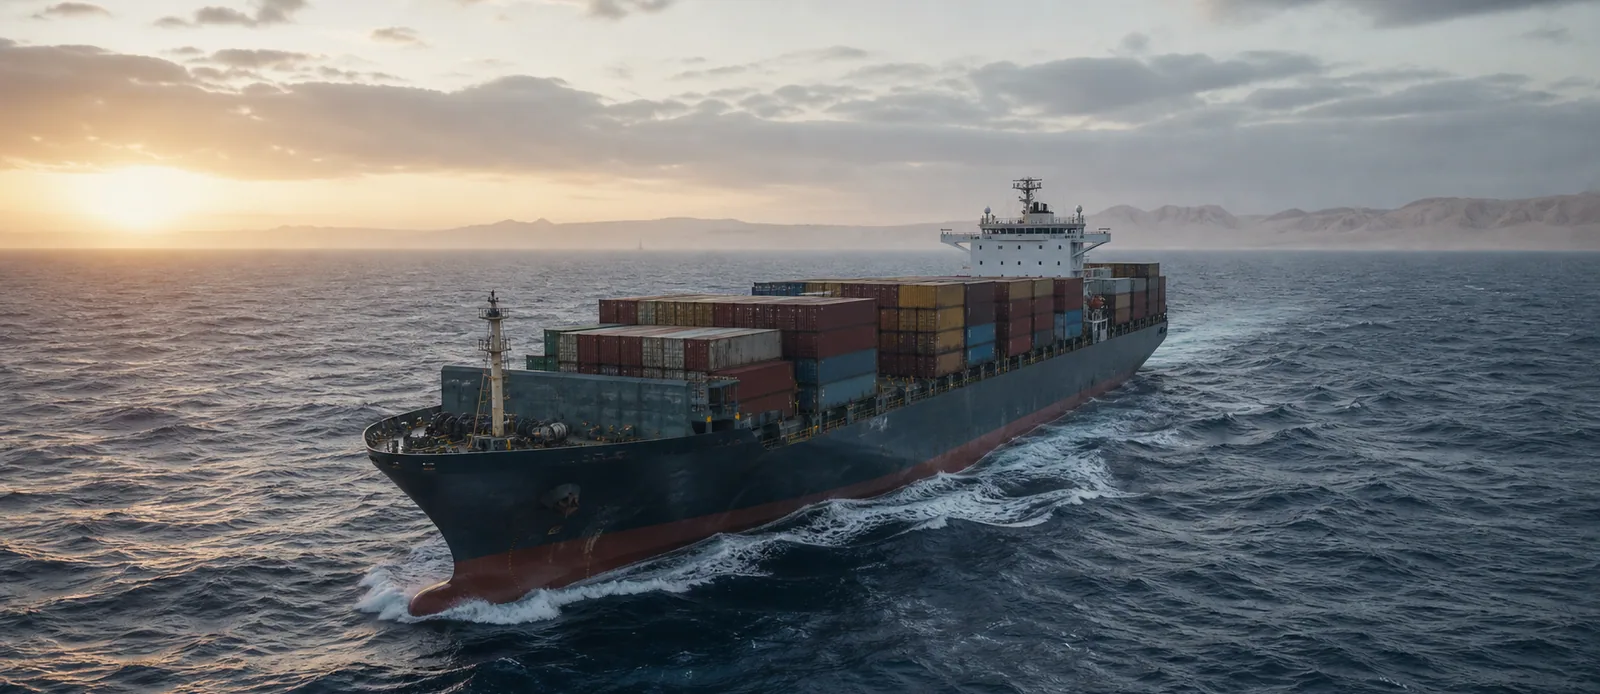
What Is the Red Sea Shipping Crisis?
When Houthi attacks on the Bab el-Mandeb strait first pushed vessels around the Cape of Good Hope, our team spent weeks resetting transit times. We reworked surcharge exposure and carrier backup plans too, for clients moving Asia-to-Europe or Asia-to-US East Coast freight. The crisis is still live in 2026. What follows is the working picture we share with importers week by week — not a frozen news snapshot.
The Red Sea links the Mediterranean Sea to the Indian Ocean through the Suez Canal and the Bab el-Mandeb strait. About 12-15% of world trade passes through this corridor, including 30% of container traffic between Asia and Europe. It's the shortest route from Asia to the US East Coast (via Suez and the Atlantic), and the main route from Asia to Europe.
Since November 2023, Houthi forces based in Yemen have struck commercial vessels in the Red Sea and Gulf of Aden with missiles, drones, and naval mines. Despite US-led coalition strikes (Operation Prosperity Guardian), attacks have kept up into 2026. They come often enough, and hit hard enough, to make the route tough to insure at standard rates for most carriers.
The result: the world's major ocean carriers now send vessels around the Cape of Good Hope at Africa's southern tip. That adds 3,000-3,500 nautical miles and 10-14 days to Asia-Europe and Asia-US East Coast voyages. This reroute ripples out to rates, capacity, schedules, and supply chains around the world.
How the Red Sea Crisis Affects Shipping Rates in 2026
The Cape of Good Hope diversion hits costs two ways: it burns more fuel, and it eats up fleet capacity. Longer voyages need more fuel per container and tie up vessels longer, which cuts the number of trips each vessel can make each year.
In 2026, the rate hit shifts a lot by trade lane:
| Trade Lane | Rate Impact vs Pre-Crisis | Additional Transit Days | Key Factor |
|---|---|---|---|
| Asia → Europe | +25-40% | +10-14 days | Direct diversion route; greatest impact |
| Asia → US East Coast (via Suez) | +15-25% | +8-12 days | Vessels diverted around Africa + Atlantic |
| Asia → US West Coast | +5-10% | 0-2 days | Pacific route unaffected but capacity spillover |
| Asia → Mediterranean | +30-45% | +10-14 days | Severe; Med ports lose Suez shortcut |
| India → Europe | +20-35% | +7-10 days | Indian Ocean origin, significant diversion |
| Middle East → Europe | +15-30% | +5-8 days | Some Persian Gulf ports less affected |
| Intra-Asia | +0-5% | 0 days | Minimal direct impact |
| Americas Routes | +3-8% | 0-2 days | Indirect: capacity reallocation effects |
The Capacity Crunch: Why Longer Voyages Affect All Trade Lanes
Even if your shipments never touch the Red Sea, the crisis still hits you. Here's why:
The world's container fleet has a fixed number of ships. When each Asia-Europe round trip takes 10-14 days longer, carriers need more ships to keep the same sailing schedule. That pulls vessels away from other routes, and squeezes capacity worldwide.
In 2026, an estimated 5-7% of the global container fleet is tied up in the longer Cape of Good Hope route. That's like pulling 1.3-1.8 million TEU of capacity clean out of the market. The fallout:
Carriers have shifted vessels from less profitable routes (Intra-Asia, Latin America, Africa) to the busy Asia-Europe and Asia-US lanes. This chain reaction means even routes that never touch the Red Sea end up with tighter space and slightly higher rates. The same squeeze pushes up LCL shipping rates for smaller shipments.
For context, the Red Sea diversion is the biggest sustained shock to world shipping since COVID-19. The cost hit is smaller this time (2021-2022 saw rates spike 10x), but it's lasting longer, and the industry has less spare capacity to absorb it.
Transit Time Impact: Route-by-Route Breakdown
Longer transit times often hurt more than higher rates do. More days at sea means more of your cash is tied up in goods afloat, higher carrying costs, and the need for bigger safety stock. Here's how transit time shifts by route:
| Route | Pre-Crisis Transit | 2026 Transit (via Cape) | Added Days |
|---|---|---|---|
| Shanghai → Rotterdam | 28-32 days | 38-46 days | +10-14 |
| Shenzhen → Hamburg | 30-34 days | 40-48 days | +10-14 |
| Shanghai → New York (via Suez) | 32-36 days | 40-48 days | +8-12 |
| Mumbai → Rotterdam | 18-22 days | 28-32 days | +10 |
| Singapore → Genoa | 16-20 days | 26-32 days | +10-12 |
| Jeddah → Rotterdam | 10-12 days | 22-26 days | +12-14 |
| Shanghai → Los Angeles (Pacific) | 14-18 days | 14-18 days | 0 |
| Shanghai → Miami (via Panama) | 28-32 days | 28-32 days | 0 |
How to Protect Your Supply Chain from Red Sea Disruptions
You can't control geopolitics, but you can build resilience into your supply chain. Here are proven strategies for navigating the Red Sea crisis:
- Shift to Pacific Routing Where Possible — For US-bound cargo from East Asia, the transpacific route to the US West Coast sits outside the Red Sea mess. Landing on the West Coast, then moving by rail or truck to the East Coast, can now beat the all-water Asia-Suez-East Coast service. It wins on both speed and cost. Compare your options with our Transit Time Calculator.
- Increase Safety Stock and Order Lead Times — With 10-14 extra transit days, your reorder point needs to move earlier. Add 2-3 weeks to your planning lead time on any route that used to run through the Red Sea. It costs more in tied-up cash, but it stops costly stockouts.
- Lock In Contract Rates — Spot rates on hit lanes swing hard and carry a crisis premium. If you ship steady volume, lock in a 6-12 month service contract with Cape routing already priced in. Contract rates usually sit 15-25% below spot on disrupted lanes.
- Diversify Carrier and Route Options — Don't lean on one carrier or one route. Work with your freight forwarder to line up other carriers with different routing plans. Some carriers run split services — Cape for some sailings, Suez for others, when it's safe to do so.
- Consider Air Freight for Critical Shipments — For high-value or time-critical cargo, the cost gap between ocean and air freight shrinks once you count the extra 10-14 days at sea. If the longer transit risks a stockout that costs more than the air premium, switch modes for that shipment.
- Review Your Cargo Insurance — War risk premiums for Red Sea transit have jumped. If your cargo passes through the region — even briefly, during Cape diversion — check that your cargo insurance covers war risk, and know the extra premium. Some policies leave out Red Sea transit entirely.
- Explore Nearshoring and China+1 Strategies — The Red Sea crisis builds the case for spreading your supply sources closer to your market. Mexico nearshoring and China+1 strategies cut your dependence on long ocean routes that geopolitics can knock off course.
Which Industries Are Most Affected?
The Red Sea crisis doesn't hit every industry the same way. The impact turns on where you source from, how dense your cargo's value is, and how much delay you can absorb:
- Automotive: High Impact — Just-in-time supply chains — parts moving from Asia and the Middle East to European and US plants — take a hard hit. Even a 2-3 day delay can stop a production line. Many carmakers have switched to air freight for key parts and built up bigger buffer stock.
- Retail & E-Commerce: Moderate-High Impact — Seasonal stock from Asia — holiday goods, spring and summer lines — needs tight timing. Longer transit shrinks the selling window and raises the odds of late arrivals. Fast-fashion brands feel this the most.
- Energy & Chemicals: Moderate Impact — Oil and LNG tankers get targeted less often, but still pay higher insurance. Chemical tankers passing through the Red Sea carry war risk premiums of 0.5-1.0% of vessel value.
- Food & Agriculture: Moderate Impact — Perishable goods and time-sensitive commodities — fresh produce, dairy, meat — feel the longer transit. Some reefer cargo has moved to air freight or new sourcing. Shelf life makes those extra 10-14 days a real problem.
- Transpacific Importers: Low Direct Impact — Companies sourcing only from East Asia to the US West Coast via the Pacific route see little direct rate impact. But they may run into equipment shortages, as containers get pulled away for the longer Cape routes.
Red Sea Crisis Timeline & Outlook
Knowing where the crisis stands, and where it's headed, helps with long-term planning:
November 2023: Houthi forces start attacking commercial vessels in the Red Sea, after the Israel-Gaza conflict breaks out. Early attacks hit Israeli-linked vessels, then quickly widen to general commercial traffic.
January 2024: Major carriers — Maersk, MSC, Hapag-Lloyd, CMA CGM — announce Red Sea diversions around the Cape of Good Hope. Asia-Europe spot rates jump 200-300% within weeks.
February 2024: The US and UK launch Operation Prosperity Guardian, striking Houthi positions from the air. Attacks keep going despite the military push.
Mid-2024 to 2025: the crisis becomes the new normal. Carriers reset schedules, add more vessels on diverted routes, and rates level off at a higher plateau. Insurance for Red Sea transit stays very costly.
In 2026, most carriers still run Cape routing as the default for Asia-Europe and Asia-US East Coast services. A few carriers make occasional Suez runs when attacks slow down, but that's the exception, not the rule. The conflict shows no sign of a quick end.
Outlook for 2027: Most of the industry expects Red Sea diversions to run through at least 2027. Carriers have already reset fleet plans and new orders for a long disruption. New vessel deliveries — 3.2M TEU on order — should help soak up the capacity gap, and may ease rates by mid-2027.
What This Means for Your Shipping Budget
Let's put a number on the Red Sea impact for a typical import setup. Scene: a US retailer bringing in 50 FCL containers a year from China, split between the East Coast (30 containers) and West Coast (20 containers).
For the 30 East Coast containers, the Red Sea premium adds about $800-$1,500 per container in direct freight cost, plus $300-$500 in extra insurance and surcharges. That's $33,000-$60,000 in extra freight cost a year.
But the bigger cost is tied-up cash. With 10 extra transit days per shipment, you carry 300 extra container-days of inventory at sea each year. At an average cargo value of $60,000 per container, and a 20% yearly carrying cost, that's about $10,000 in extra working capital cost a year.
Total Red Sea impact for this scene: $43,000-$70,000 a year. Most businesses can absorb that, but it's big enough to justify a change in strategy.
For the 20 West Coast containers, the direct hit is small ($100-$200/container from capacity spillover). But equipment shortages can cause the odd 1-3 day delay during peak season.
The move to make: build Red Sea premiums into your 2026-2027 shipping budgets. Review your East Coast vs. West Coast routing mix. And work with your freight forwarder to fit the current climate.
Decision Framework: Reroute, Hold, or Switch Modes?
When a shipment is already booked and Red Sea risk hits your lane, this isn't a theory question. It's a five-day call. That call decides whether your cargo lands on time, lands late, or leaves you exposed to a war-risk insurance gap. Use this framework to decide in hours, not weeks.
The call turns on four things. How critical the cargo is, how much budget you can flex, what alternate routes exist, and what your insurance covers. Check your shipment against each one before you commit to a plan.
- Step 1 — Classify cargo criticality — Is the shipment JIT-bound, perishable, or tied to a launch or season window? If yes, treat transit-time risk as costlier than rate risk, and price out air or sea-air from day one. If no, the Cape reroute is usually the simplest, cheapest default.
- Step 2 — Re-run landed cost with Cape premium baked in — Don't compare pre-crisis rates to today's rates — that gap will make any option look cheap by comparison. Compare Cape ocean to air and rail with 2026 rate cards, including peak season surcharges, GRIs, and war-risk cover where it applies. Use our Freight Calculator or Transit Time Calculator to check the options fast.
- Step 3 — Validate alternative routing feasibility — Rail from China to Europe needs cargo that's non-reefer, non-hazmat, fits TEU dimensions, and gets booked 2-3 weeks ahead. Air has weight and commodity limits, especially for lithium batteries, aerosols, and dangerous goods. Check that the option actually accepts your cargo type before you price it out.
- Step 4 — Confirm insurance follows the routing — Standard marine cargo policies often leave out war risk, and may name Red Sea transit as excluded. If your carrier routes via Suez during a quiet spell, check your policy covers it. If you switch to air mid-journey, check the transload warehouse is covered too. Gaps here hit your bottom line hard if anything goes wrong.
- Step 5 — Document the decision and the rate card — Red Sea pricing swings fast — last week's quote may not hold this week. Lock your call with a written rate confirmation, routing disclosed, and a clear expiration date. That way your team can move fast, without re-arguing the plan every time a new booking comes in.
| Scenario | Best Response | Expected Cost Delta | Decision Trigger |
|---|---|---|---|
| Time-critical + high-value (JIT auto, medical, electronics) | Switch to air freight or sea-air via Dubai | 3-6x ocean rate, -25 to -35 days transit | Stockout cost > air premium |
| Non-critical + low-value + flexible delivery | Hold with Cape of Good Hope routing | +15-25% ocean rate, +10-14 days | Inventory buffer absorbs delay |
| East Coast destination + Asia origin | Reroute through Pacific + rail/truck to East Coast | +5-10% total, parity transit vs. delayed Suez | Equipment available at West Coast gateway |
| Europe destination + Asia origin | Evaluate China-Europe Rail Express | -10 to +5% vs. ocean, 18-22 day transit | Cargo fits rail container (no oversize, no reefer issues) |
| Recurring shipments, any lane | Lock 6-12 month contract with Cape routing priced in | -15-25% vs. spot on disrupted lanes | Volume commitment >5 TEU/month or equivalent air |
| Already in transit + Red Sea routing disclosed | Verify war-risk insurance endorsement before vessel enters Gulf of Aden | 0.5-1.0% of cargo value premium | Policy excludes war risk or Red Sea specifically |
Frequently Asked Questions
Sources & references
Explore more on these topics
Related Topics & Categories
Read the Red Sea update as an operating decision
Red Sea and Suez routing is set service by service. There is no single market-wide on-or-off status. On July 9, Maersk said its MECL service would return to the trans-Suez route during August. Maersk kept its backup plans, though. Single sailings, or the whole service, can still move back to the Cape of Good Hope if security changes.
For a live shipment, confirm the facts that matter. Check the named service, the voyage, the transshipment plan and the insurance position. Check emergency surcharges and the fallback route too. Do not apply a broad headline to every booking. The dated carrier schedule and the cargo's risk tolerance drive the operating decision.
- Find the actual service and voyage first. Then compare transit times.
- Ask if the quote assumes Suez, Cape routing or a flexible backup plan.
- Check what a route change does to insurance, surcharges and free time.
- Set the trigger for switching mode, gateway or sailing before cargo cutoff.
Request a route benchmark with a disruption fallback
A useful route benchmark compares the main plan with at least one fallback. Share the basics up front. Give the origin, destination, cargo-ready date, required delivery date, value and packed size. Flag any mode or carrier limits too.
The reply should state the assumed route, the schedule date, the validity and the surcharge scope. It should also name the event that would trigger a reroute or a mode change. Treat it as a dated planning decision. It is not a promise that future voyages will keep today's security posture.
- Main route and named service assumption
- Cape, alternate gateway or air-freight fallback
- Latest workable arrival date and the inventory impact
- Insurance, surcharge and free-time review